TLDR: This blogpost presents devi, a tool that can help you devirtualize virtual calls in C++ binaries. It uses Frida to trace the execution of a binary and uncover the call sources and destinations of virtual calls. The collected information can then be viewed in IDA Pro, Binary Ninja, or Ghidra. The plugin adds the respective control-flow edges allowing further analysis (using different plugins) or simply providing more comfort when analyzing C++ binaries.
I am sure many of you know the struggle that comes with reversing C++ binaries. You might recall one solution presented at Troopers 18. Gal Zaban presented (Video, Slides) Virtuailor, an IDA Pro plugin which uses the IDA Pro debugger to reconstruct the vtables of the analyzed binary. I highly encourage you to watch her talk! You can find our summary of her talk here. This summary also covers the basics of virtual calls in C++ binaries.
Virtuailor requires a debugger and only supports IDA Pro as an analysis tool. In case you want to use another tool (e.g., Ghidra or Binary Ninja) or don’t have access to a debugger and are fine with not reconstructing the vtables but only reconstructing the actual control-flow, you can use devi.
The creation of devi is one of these “two birds with one stone” attempts. For a university assignment, I had to present on a technical topic of my choosing. At the same time, Frida had piqued my interest, and I wanted to do something useful with it. Writing an IDA Pro plugin was not high on my interest list as I did not encounter many people who are fond of the IDA Pro Python API. However, at that time, Binary Ninja did not yet have support for user-defined cross-references. You can find the presentation with some examples and my thought process here. It should be noted though that the presentation has been given some time ago. This means, for example, that the maturity of Frida and its documentation has improved in the meantime.
On the last slide of the presentation, I mention further plans. Some of them have finally been realized. No, I’m not talking about the tests; they are still missing. Devi now supports IDA Pro, Binary Ninja, and finally, Ghidra. Frida is still the only supported dynamic binary instrumentation (DBI) framework. However, I’m hopeful that this will change in the future.
In this next section, I will walk you through the usage of devi with a simple example and show the results in the newly developed Ghidra plugin.
An example of a trivial Hello World program with virtual calls can be found in the devi repository on GitHub. For this blog post, we take a look at the test suite of pugixml.
After building pugixml, we have access to the compiled test suite. As a first step, we want to familiarize ourselves with the binary. This can be done with Frida.
With “frida ./test”, we are dropped into an interactive read-evel-print loop (REPL).
In the next step, we want to know which modules Frida can identify:
[Local::test]-> Process.enumerateModulesSync()
[
    {
        "base": "0x560705e14000",
        "name": "test",
        "path": "/tmp/pugixml/build/make-g++-debug-standard-c++11/test",
        "size": 2940928
    },
    […]
]
Now we want to determine the symbols in the “test” module and find the main symbol:
[Local::test]-> symbols = Module.enumerateSymbolsSync("test")
[Local::test]-> for (i=0; i<symbols.length; i++) { if (symbols[i]["name"] == "main") { console.log(JSON.stringify(symbols[i])) } };
{"isGlobal":true,"type":"function","section":{"id":"13.text","protection":"r-x"},"name":"main","address":"0x55896a6a4376","size":767}
Now we are sure we have everything we need for devi. We know the module we want to trace and know that we can start tracing the main function.
$ python devi_frida.py -m test -o virtual_calls.json -k -- ./test
We do not need to specify the symbol name where we want to start tracing as the default is main. However, if you attach to a running process, you need to specify the symbol by hand.
Frida will now spawn the test suite. At main the Interceptor is attached. Interceptor is one of the two instrumentation methods used by Frida. Interceptor only allows access at function level. We now start a Stalker for this thread. Stalker is the second instrumentation mode. It offers more flexibility and finer granularity than Interceptor. It can trace five different events:
- exec: traces every instruction
- block: traces execution of basic blocks
- compile: traces only newly encountered blocks
- ret: traces return instruction
- call: traces every call instruction. That is (almost) exactly what we want for devi.
Now we receive an event at every call instruction and check if it is a call through a register. In that case, we check if it falls within the traced module and report it back to the Python client. The Python client will accumulate the call sources and destinations of the indirect calls and write them to a JSON file.
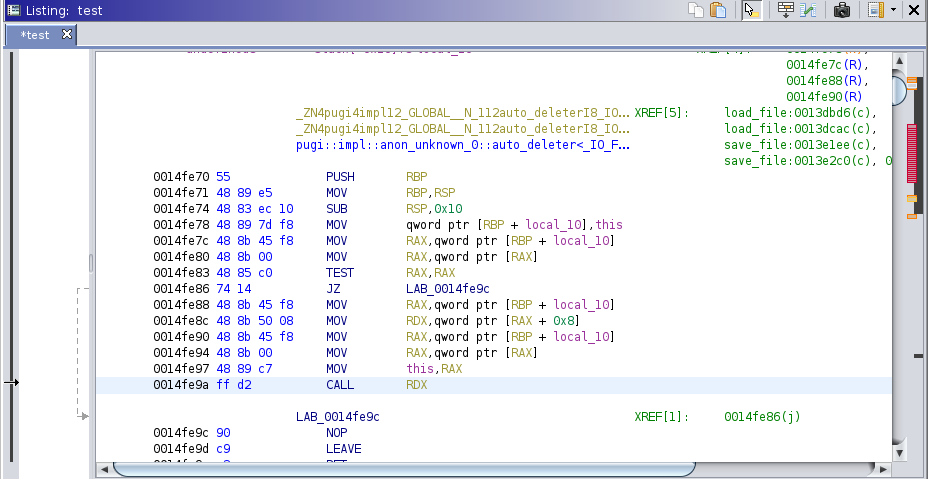
In the next step, we can load this JSON file in the disassembler. The following screenshots show Ghidra before and after devi was used.
Disassembly before devi was used:
Disassembly after devi was used, the call at 0x14fe9a now has a comment to the call target: 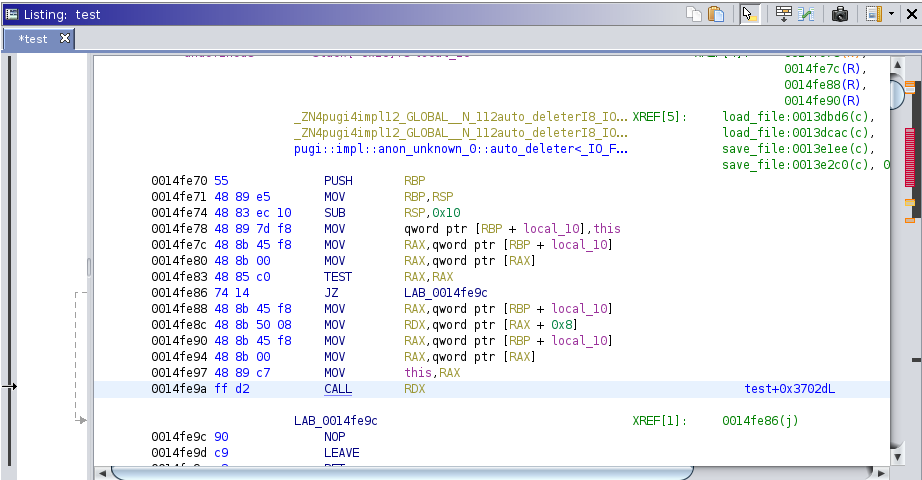
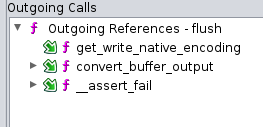
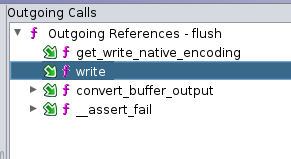
Outgoing calls of the function, left before devi, right after devi was used,. The outgoing call to write has been added:
Cross-references of the virtual function (write) before devi was used: 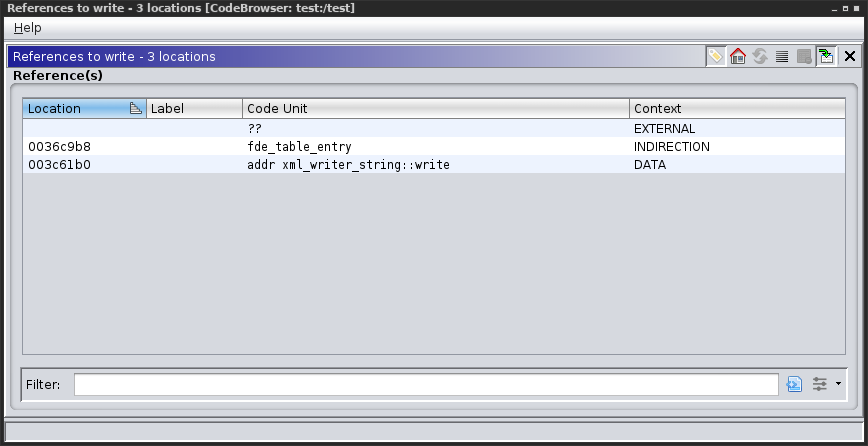
Cross-references of the virtual function (write) after devi was used, the call through the register has been added: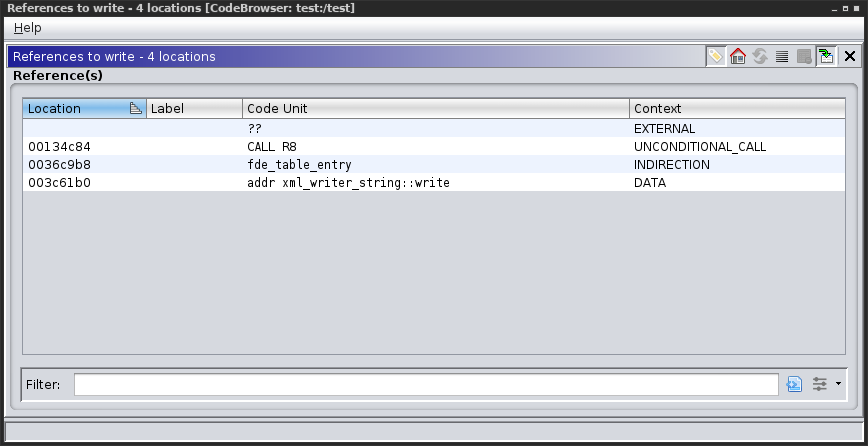
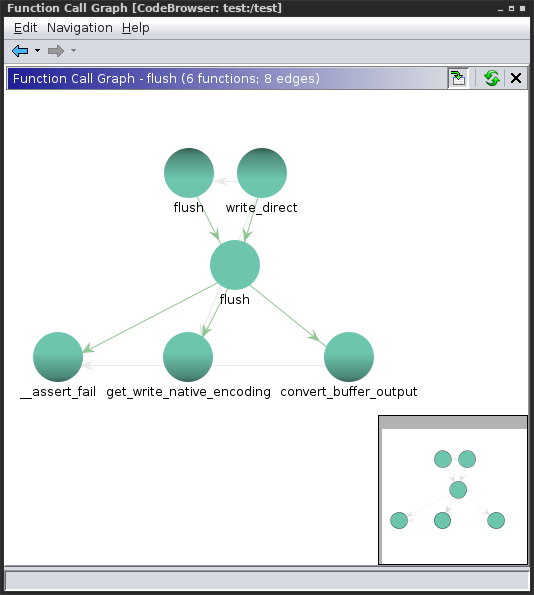
Function call graph before devi was used:
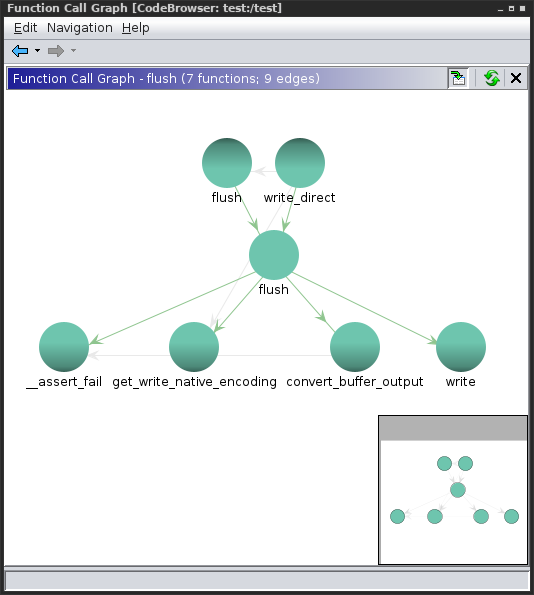
Function graph after devi was used:
You can grab the latest release from GitHub or the Binary Ninja Plugin Manager and give it a try.
Hi, Love the write up. but having trouble getting the tracing to work. it doesn’t like the symbol name, even when none is provided on windows.
Is there a way to have it trace all calls in the program? you alluded to it with the talk about stalker, but i was unable to find it.
Loving the work, keep it up. 🙂
Hi,
Thanks for the positive feedback!
The problem might be e.g., that the binary is stripped. Also it is (was) not really tested with windows. I just pushed a work in progress release with windows support in an own branch [1]. It will try to hook all threads that get created and then attach the Stalker. I only tested to attach to a running process! Spawning is untested. Also, I had some issues with detaching the session. However, the JSON file gets written once you say you want to detach. However, python might not quit. This seems to happen at least sometimes with frida [2].
If you want to trace all calls in frida you need to set call in the events for creating Stalker to true like in [3]. I simply check if the call is indirect see [4]. Frida does not have an event for indirect calls like e.g. DynamoRio [5].
[1] https://github.com/murx-/devi/tree/windows-testing
[2] https://github.com/frida/frida/issues/1056
[3] https://github.com/murx-/devi/blob/windows-testing/windows.js#L39
[4] https://github.com/murx-/devi/blob/windows-testing/windows.js#L65
[5] https://css.csail.mit.edu/6.858/2010/labs/dr-docs/dr__ir__instr_8h.html#1fe1cc575e2870720ceee8ce134771f3