I’m happy to announce the release of several Glibc heap analysis plugins (for Linux), resp. plugins to gather information from keepassx and zsh, which are now included in the Rekall Memory Forensic Framework. This blogpost will demonstrate these plugins and explain how they can be used. More detailed information, including real world scenarios, will be released after the talk at this years DFRWS USA.
Before being able to reliably analyze the heap of a process, a profile, for the Glibc version being used, must be provided. However, this step should for most cases be fairly simple and only consist of gathering the offset for the mp_ and main_arena variables:
// For dynamically linked executables:

# objdump -t /usr/lib/libc-2.24.so | egrep '\b(mp_|main_arena)\b'

001b5760 l     O .data        00000454              main_arena

001b5100 l     O .data        00000030              mp_
// For statically linked executables:
# objdump -t executable | egrep '\b(mp_|main_arena)\b'
080fc560 l O .data 00000454 main_arena
080fc520 l O .data 00000030 mp_
The relevant output is the first value in each output line of objdump, which is the offset to the struct within the mapped libc/executable file. These offsets can be provided on the command line (see later on).
While normally it would be necessary to also provide the vtype definitions (see http://www.rekall-forensic.com/docs/Developers/development.html#_the_vtypes_language) for all required structs, the plugins already come with the necessary information for Glibc versions 2.20 – 2.25 (which are also the versions that are officially supported). If however, you want to analyze a different Glibc version, those information must be provided manually. For this to work, you need to get a Glibc library that includes debug symbols. Then, you can create the vtype definitions with the following command:
rekall dwarfparser libc-2.24_debug.so > libc-2.24_debug.so.vtypes
The important definitions are those for the structs malloc_chunk, malloc_state, _heap_info and malloc_par. See https://github.com/google/rekall-profiles/blob/master/v1.0/glibc/base/I386/224.gz for an example.
When the profile is set up, the analysis can finally begin. The five main heap analysis plugins are:
- heapinfo: Provides an abstract overview over the number of arenas, chunks and their sizes.
- heapobjects: Prints the gathered heap object structs such as malloc_state (arena) and malloc_chunk (chunk).
- heapdump: Dumps all allocated and freed chunks to disk in separate files for further analysis.
- heapsearch: Searches all chunks for the given string, regex or pointer(s).
- heaprefs: Examines the data part of the given chunk(s) for any references to other chunks.
Let’s see them in action. First the plugin heapinfo (note that we provided the offsets to mp_/malloc_par and main_arena and prepended the values with 0x to mark them as hexadecimal values). The output has been split in two parts for legibility.
rekall -f memdump.raw --profile arch-pmem-4.4.5.json heapinfo --malloc_par=0x001b5100 --main_arena=0x001b5760 18392
pid arenas heap_infos non_mmapped_chunks non_mmapped_chunks_size
------ ------ ---------- -------------------- --------------------------
18392 3 12 448 16374208
mmapped_chunks mmapped_chunks_size freed_chunks freed_chunks_size
---------------- ---------------------- -------------- --------------------
20 10043392 159 28464
- pid: The PID of the analyzed process.
- arenas: The amount of discovered malloc state instances. In this case three, which typically means that the process had at least three running threads (including the main thread).
- heap_infos: The amount of discovered heap info instances. This will be explained in more detail in the next blogpost on this topic.
- non_mmapped_chunks: The amount of all main and thread heap chunks, excluding MMAPPED chunks. In essence, all chunks from all threads below a certain size boundary (will also be explained in more detail in the next blogpost on this topic).
- non_mmapped_chunks_size: The summarized size of all main and thread heap chunks (excluding MMAPPED chunks).
- mmapped_chunks: The amount of all MMAPPED chunks.
- mmapped_chunks_size: The size of all MMAPPED chunks.
- freed_chunks: The amount of all freed bin and fastbin chunks, not including top chunks.
- freed_chunks_size: The size of all freed bin and fastbin chunks, not including top chunks.
The plugin heapobjects enables a more detailed view (in this case, also activated freed chunks printing):
rekall -f memdump.raw --profile arch-pmem-4.4.5.json heapobjects --malloc_par=0x001b5100 --main_arena=0x001b5760 --print_freed 18392
================== Arena and heap_info objects ==================
Main_arena: [malloc_state next] @ 0xB7781760
0x00 mutex [int:mutex]: 0x00000000
0x04 flags [int:flags]: 0x00000000
0x08 fastbinsY
0x30 top
0x34 last_remainder
0x38 bins
0x430 binmap
0x440 next
0x444 next_free
0x448 attached_threads [unsigned int:attached_threads]: 0x00000002
0x44C system_mem [unsigned int:system_mem]: 0x00557000
0x450 max_system_mem [unsigned int:max_system_mem]: 0x00557000
First chunk: [malloc_chunk malloc_chunk] @ 0x0972D000
0x00 prev_size [unsigned int:prev_size]: 0x00000000
0x04 size [unsigned int:size]: 0x00001009
0x08 fd
0x0C bk
0x10 fd_nextsize
0x14 bk_nextsize
Top chunk: [malloc_chunk top] @ 0x09C65938
0x00 prev_size [unsigned int:prev_size]: 0x00000000
0x04 size [unsigned int:size]: 0x0001E6C9
0x08 fd
0x0C bk
0x10 fd_nextsize
0x14 bk_nextsize
Thread arena: [malloc_state next] @ 0xB5100010
0x00 mutex [int:mutex]: 0x00000000
0x04 flags [int:flags]: 0x00000002
0x08 fastbinsY
0x30 top
0x34 last_remainder
0x38 bins
0x430 binmap
0x440 next
0x444 next_free
0x448 attached_threads [unsigned int:attached_threads]: 0x00000001
0x44C system_mem [unsigned int:system_mem]: 0x00551000
0x450 max_system_mem [unsigned int:max_system_mem]: 0x00551000
Top chunk: [malloc_chunk top] @ 0xB4B35CE8
0x00 prev_size [unsigned int:prev_size]: 0x00000000
0x04 size [unsigned int:size]: 0x0001B319
0x08 fd
0x0C bk
0x10 fd_nextsize
0x14 bk_nextsize
[_heap_info prev] @ 0xB5100000
0x00 ar_ptr
0x04 prev <_heap_info Pointer to [0x00000000] (prev)>
0x08 size [unsigned int:size]: 0x00100000
0x0C mprotect_size [unsigned int:mprotect_size]: 0x00100000
0x10 pad
First chunk: [malloc_chunk malloc_chunk] @ 0xB5100468
0x00 prev_size [unsigned int:prev_size]: 0x00000000
0x04 size [unsigned int:size]: 0x0001000D
0x08 fd
0x0C bk
0x10 fd_nextsize
0x14 bk_nextsize
[...]
================== Freed Chunks ==================
[malloc_chunk fastbinsY[0] ] @ 0x0972EC78
0x00 prev_size [unsigned int:prev_size]: 0x00000000
0x04 size [unsigned int:size]: 0x00000011
0x08 fd
0x0C bk
0x10 fd_nextsize
0x14 bk_nextsize
[malloc_chunk fastbinsY[2] ] @ 0x0972E068
0x00 prev_size [unsigned int:prev_size]: 0x00000000
0x04 size [unsigned int:size]: 0x00000021
0x08 fd
0x0C bk
0x10 fd_nextsize
0x14 bk_nextsize
[...]
The heapdump plugin dumps all chunks in separate files using unique filenames. These files can then be used for further analysis. The output of heapdump is pretty simple:
rekall -f memdump.raw --profile arch-pmem-4.4.5.json heapdump --malloc_par=0x001b5100 --main_arena=0x001b5760 --dump_dir dumpdir 18392
pid allocated freed_bin freed_fastbin top_chunks
------ ------------ ------------ -------------- ------------
18392 476 146 13 3
- pid: The PID of the analyzed process.
- allocated: The amount of all allocated chunks that have been dumped (including main, thread arena, MMAPPED and bottom chunks; see next blogpost).
- freed_bin: The amount of dumped freed small and large bin chunks.
- freed_bin: The amount of dumped freed fastbin chunks.
- top_chunks: The amount of dumped top chunks.
The filename format is as follows:
PID.CHUNK-TYPE_OFFSET_CHUNKSIZE_DUMPEDSIZE_STRIPPED
- PID: The PID of the process. It is useful when dumping multiple processes in the same directory.
- CHUNK-TYPE: Can be one of the following: allocated-main, allocated-thread, allocated-mmapped, freed-bin, freed-fastbin, top and bottom.
- OFFSET: The address of the malloc_chunk struct within the virtual address space.
- CHUNKSIZE: The size taken from the chunk’s size member (no flag bits).
- DUMPEDSIZE: The amount of bytes that have been dumped into the file. This value can in some cases be zero (most often the case with bottom chunks, but also e.g. with a freed bin chunk and a size of 16; will be explained in the next blogpost), but the file is created anyways to not hide the existence of that chunk from the investigator.
- STRIPPED: The amount of bytes that have been stripped from the output. This step is necessary to not include heap management data in the dumped files, which can be mistakenly interpreted as user data. Stripping is only done on freed chunk (they contain pointers that override user data).
Examples are:
18392.freed-fastbin-chunk_offset-0x0972E158_size-40_dumped-32_stripped-4.dmp

18392.freed-bin-chunk_offset-0xB53356B8_size-392_dumped-376_stripped-8.dmp

18392.allocated-main-chunk_offset-0x09731F50_size-360_dumped-356_stripped-0.dmp
The heapsearch plugin helps the investigator in identifying a chunk of interest. This can e.g. be done by searching for a specific string or pointer, which is expected to be contained in a chunk. When a match is found, the according malloc_chunk struct is printed, including its virtual address. The supported command line options are:
- pointers: Prints chunks that contain exactly the given pointer(s). The pointer(s) can be given as (hexa)decimal numbers.
- regex: Searches all chunks with the given regex and prints all hits.
- string: Searches all chunks for the given string and prints all hits.
- chunk_addresses: Expects address(es) belonging to a chunk(s) of interest and prints all chunks having a pointer somewhere into the data part of that chunk(s).
- search_struct: Includes the malloc_struct fields in the search process, which means the size field for all chunks and prev_size, fd, bk, fd_nextsize and bk_nextsize for bin chunks. This is normally not desired and hence deactivated by default.
The following example searches for a given pointer in all chunks:
rekall -f memdump.raw --profile arch-pmem-4.4.5.json heapsearch --malloc_par=0x001b5100 --main_arena=0x001b5760 heapsearch 18507 --pointers=0x843f0d8


================== Search results ==================
The chunk (0x843FA80) below contains:
The following needle at the given offset(s):
Needle Offset(s)
----------------------
0x843f0d8: 0x843FB50
[malloc_chunk malloc_chunk] @ 0x0843FA80
0x00 prev_size [unsigned int:prev_size]: 0x00000000
0x04 size [unsigned int:size]: 0x000000D1
0x08 fd <malloc_chunk Pointer to [0x44444444] (fd)>
0x0C bk <malloc_chunk Pointer to [0x44444444] (bk)>
0x10 fd_nextsize <malloc_chunk Pointer to [0x44444444] (fd_nextsize)>
0x14 bk_nextsize <malloc_chunk Pointer to [0x44444444] (bk_nextsize)>
============================================================
While the search options pointers, string and regex are fairly straight forward, chunk_addresses might require some additional explanation. The scenario for this option: We identified a chunk of interest and want to know, which chunks contain a pointer/reference somewhere to that chunk. The algorithm expects at least one chunk of interest and searches the whole data part of all chunks (includes the chunk of interest) for a pointer somewhere to the chunk of interest.
+--------------------+      +--------------------+

|                    |      |                    |

| chunk with pointer---------> chunk of interest |

|                    |      |         ^          |

+--------------------+      +---------|----------+

                                      |

                       +--------------|-----+

                       |              |     |

                       | chunk with pointer |

                       |                    |

                       +--------------------+
Following an example output:
rekall -f memdump.raw --profile arch-pmem-4.4.5.json heapsearch --malloc_par=0x001b5100 --main_arena=0x001b5760 heapsearch 18507 --chunk_addresses=0x843f0d0


We found the following chunks for the given chunk_addresses (all other chunks

will now be searched for pointers to them):
[malloc_chunk malloc_chunk] @ 0x0843F0D0
0x00 prev_size [unsigned int:prev_size]: 0x00000000
0x04 size [unsigned int:size]: 0x000000D1
0x08 fd <malloc_chunk Pointer to [0x41414141] (fd)>
0x0C bk <malloc_chunk Pointer to [0x42424242] (bk)>
0x10 fd_nextsize <malloc_chunk Pointer to [0x42424242] (fd_nextsize)>
0x14 bk_nextsize <malloc_chunk Pointer to [0x42424242] (bk_nextsize)>
================== Search results ==================
The chunk (0x843FE88) below contains:
The following pointers at the given offset(s) to the chunk at offset 0x843F0D0:
Pointer Offset(s)
----------------------
0x843F1A3: 0x843FF58
[malloc_chunk malloc_chunk] @ 0x0843FE88
0x00 prev_size [unsigned int:prev_size]: 0x47474747
0x04 size [unsigned int:size]: 0x000000D1
0x08 fd <malloc_chunk Pointer to [0x48484848] (fd)>
0x0C bk <malloc_chunk Pointer to [0x48484848] (bk)>
0x10 fd_nextsize <malloc_chunk Pointer to [0x48484848] (fd_nextsize)>
0x14 bk_nextsize <malloc_chunk Pointer to [0x48484848] (bk_nextsize)>
============================================================
The chunk (0x843FA80) below contains:
The following pointers at the given offset(s) to the chunk at offset 0x843F0D0:
Pointer Offset(s)
----------------------
0x843F0D8: 0x843FB50
[malloc_chunk malloc_chunk] @ 0x0843FA80
0x00 prev_size [unsigned int:prev_size]: 0x00000000
0x04 size [unsigned int:size]: 0x000000D1
0x08 fd <malloc_chunk Pointer to [0x44444444] (fd)>
0x0C bk <malloc_chunk Pointer to [0x44444444] (bk)>
0x10 fd_nextsize <malloc_chunk Pointer to [0x44444444] (fd_nextsize)>
0x14 bk_nextsize <malloc_chunk Pointer to [0x44444444] (bk_nextsize)>
============================================================
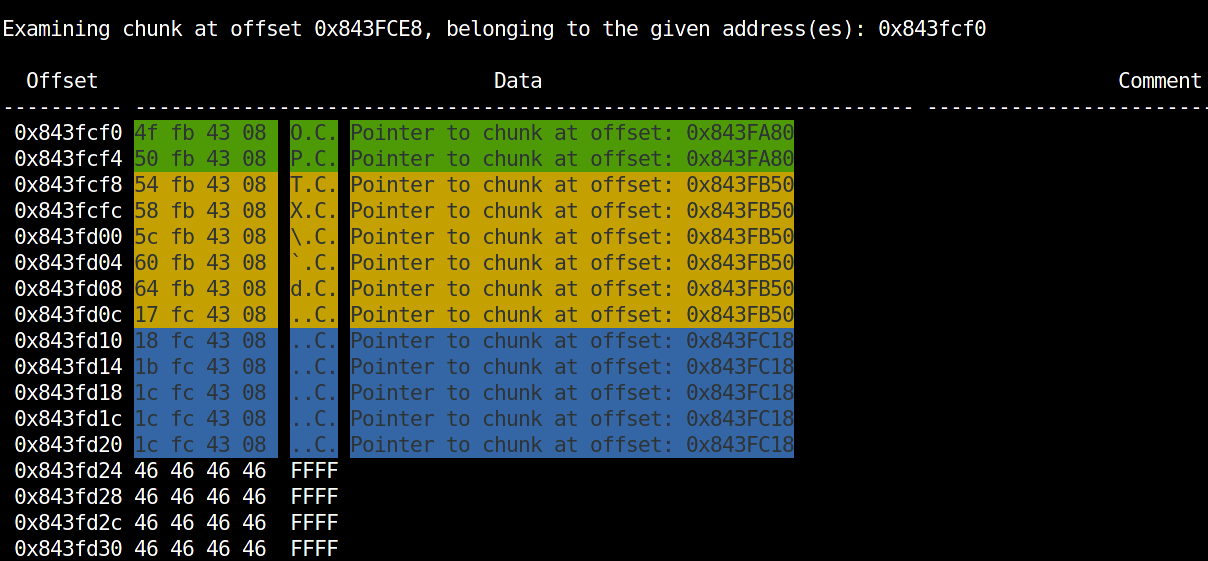
The last plugin, heaprefs works the other way around. It expects a chunk of interest and searches it for pointers to other chunks.
                             +--------------------+

                             |                    |

                             |       chunk        |

                             |                  ^ |

                             +------------------|-+

                                                |

+--------------------+      +-------------------|----+

|                    |      |                   P    |

|       chunk     <------------P   chunk of interest |
|                    |      |                        |
+--------------------+      +------------------------+
The 'P's represent a pointer within the chunks data part.
Following an example output for this plugin:
rekall -f memdump.raw --profile arch-pmem-4.4.5.json heapsearch --malloc_par=0x001b5100 --main_arena=0x001b5760 heaprefs 18507 --chunk_addresses=0x843fcf0
The last two plugins we want to introduce are the result of our user space process analyses and are extracting the command history for the zsh shell and password entry information for the password manager KeePassX. Again, more detailed information about the analysis approach and how the plugins work will be released in the next blogpost.
The zsh plugin gathers all executed commands with timestamps from the heap of a zsh shell process:
rekall -f memdump.raw --profile arch-pmem-4.4.5.json zsh --malloc_par=0x001b5100 --main_arena=0x001b5760 370
- counter started ended command
-------- ------------------------ ------------------------ -------
1 2016-03-31 23:51:09Z 2016-03-31 23:51:09Z 'vi abc'
2 2016-03-31 23:51:21Z 2016-03-31 23:51:21Z 'who'
[...]
1865 2017-06-29 15:33:16Z 2017-06-29 15:33:16Z 'cd malloc'
1866 2017-06-29 15:33:17Z 1970-01-01 00:00:00Z './heaprefstest'
Note: The timestamp 1970-01-01 00:00:00Z for entry 1866 results from a still running process.
The keepassx plugin extracts the title, username, URL and comment field of all retrievable password entries from the heap of the password manager KeePassX. The following output has been split in two parts for legibility.
rekall -f memdump.raw --profile arch-pmem-4.4.5.json keepassx --malloc_par=0x001b5100 --main_arena=0x001b5760 559


- entry            title                        url

  ------ -------------------------- ----------------------------

  1      u''                        u''

  2      u'facebook'                u'http://facebook.com'

  3      u'gmail'                   u'https://www.google.com/gma

                                    il/'

  4      u'gmx'                     u'www.gmx.de'

  5      u'apple id'                u'https://appleid.apple.com'


  6      u''                        u''

  7      u'q'                       u'/\x00\u0814 \x00'

  8      u''                        u''


           username                             comment

 ---------------------------- --------------------------------------------

 u''                          u''

 u'hans.wurst'                u'this is a comment'

 u'hans.wurst@gmail.com'      u'old password: Password123'

                                    il/'

 u'hans.wurst@gmx.de'         u'backup mail: hans.wurst@gmail.com'

 u'hans.wurst@gmx.de'         u'my security questions:\nchildrens book:

                              faust\nparents met: 01.01.1970\nfirst album

                              purchased: Helene Fischer - Farbenspiel'

 u''                          u''

 u''                          u''

 u''                          u''
That's it so far. Stay tuned for the second blogpost.
\x00
Frank