Hi everybody,
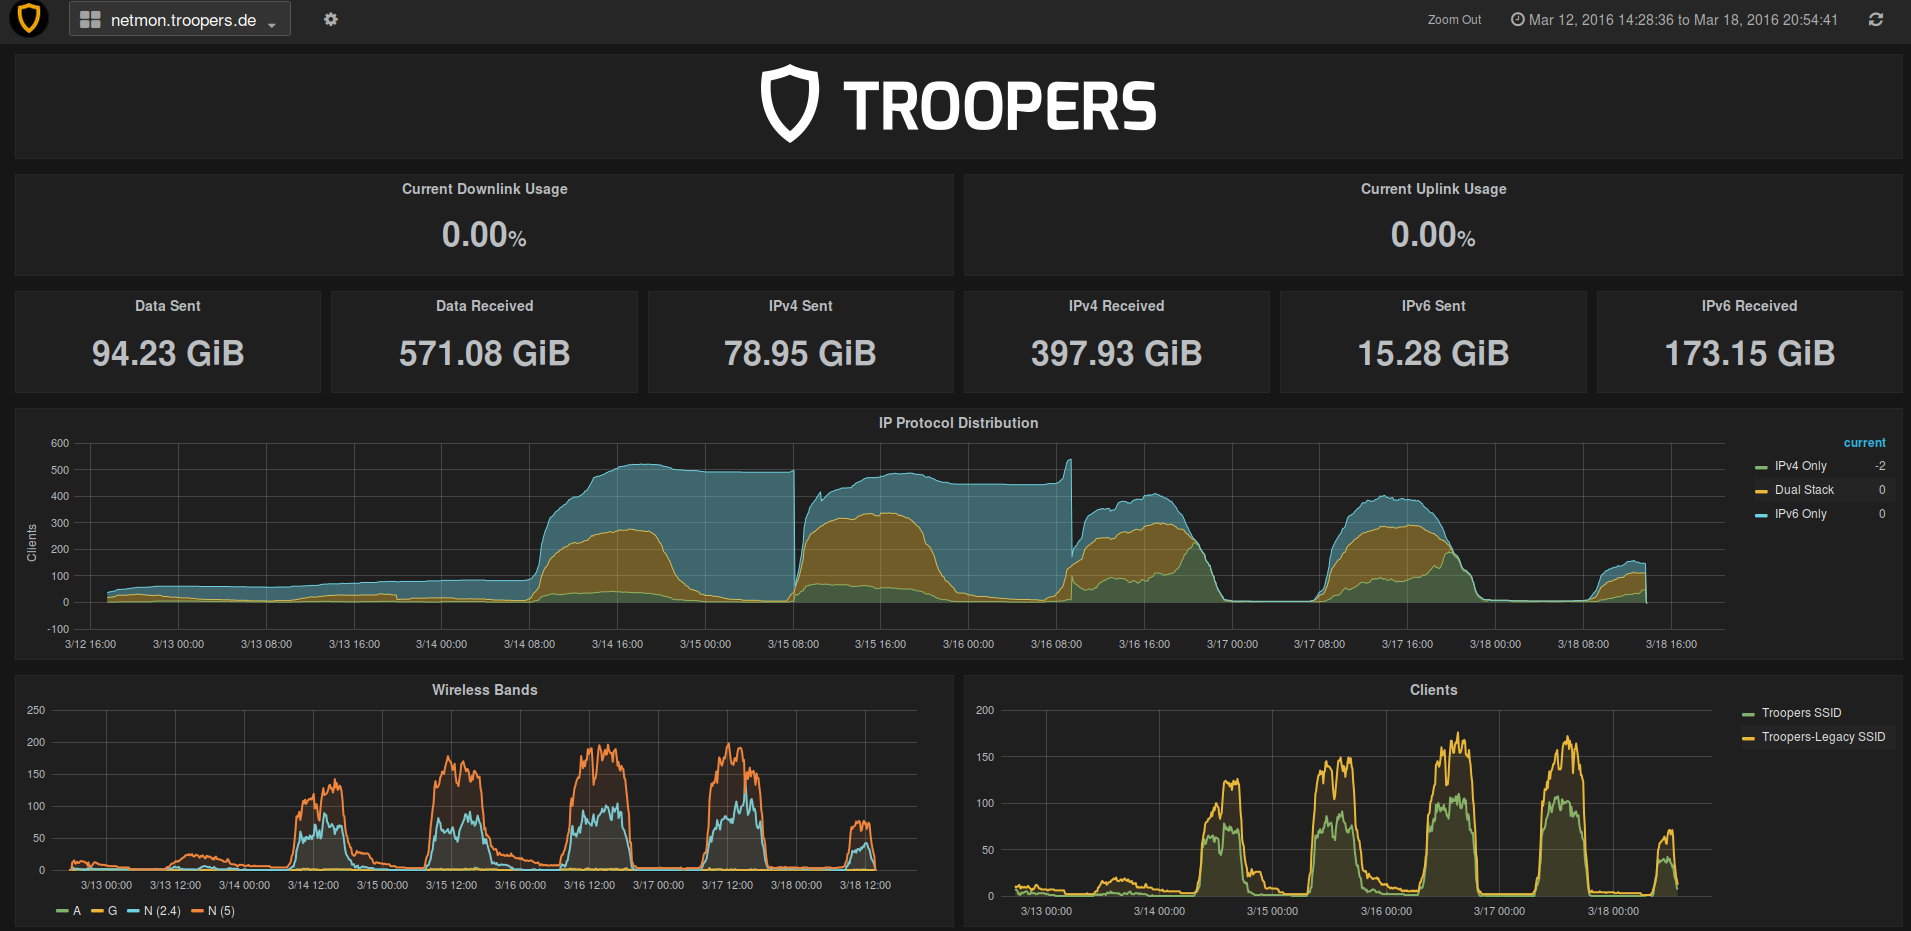
Christopher talked already about our WiFi Network during the IPv6 Security Summit and mentioned our monitoring system (we like to call “netmon”). As there were quite some people interested in the detailed setup and configuration, we would like to share the details with you. This year we used a widely known frontend called Grafana and as backend components InfluxDB and collectd. During Troopers the monitoring system was public reachable over IPv6 and provided statistics about Uplink Bandwidth, IP Protocol Distribution, Clients and Wireless Bands.
The Setup
The netmon server was running on a Ubuntu 16.04 LTS (Xenial Xerus). For the frontend Dashboard we used Grafana. The database was a Influxdb in version 0.10 and for collecting data we used collectd in version 5.5 and three scripts described in the bottom.
First we started with installing Grafana and used the latest deb package provided from the official website.
wget https://grafanarel.s3.amazonaws.com/builds/grafana_2.6.0_amd64.deb

sudo apt-get install adduser libfontconfig

sudo dpkg -i grafana_2.6.0_amd64.deb
After starting the grafana servcie the GUI is accessible via link http://$IP_of_the_server:3000. We changed the default credentials and continued with the installation of Influxdb and collecd.
sudo apt-get install influxdb collectd
Then we started to configure the influxdb and created a dedicated database.
CREATE DATABASE collectd
Next step was to secure the database. For that purpose we created two user. One admin user and one read only user for the collectd database which is later used by Grafana to read the values from the database.
CREATE USER <username> WITH PASSWORD '<password>' WITH ALL PRIVILEGES

CREATE USER 'collectd_readonly' WITH PASSWORD '<password>'

GRANT READ ON collectd TO 'collectd_readonly'
We edited the configuration file (/etc/influxdb/influxdb.conf) to enable the authentication and collectd module.
[http]

auth-enabled = true
[collectd]

enabled = true

bind-address = "127.0.0.1:$Port" #chose a free unused Port

database = "collectd"

typesdb = "/usr/share/collectd/types.db" #defenition of the types collectd use
As the database is now configured properly, we need to configure the collectd service. Since we were using SNMPv3, we had to make sure that collectd 5.5 is installed, as SNMPv3 support was integrated in this release.
Which brings us to the configuration file (/etc/collectd/collectd.conf) to enable the SNMP plugin and configure it.
LoadPlugin snmp
<Plugin snmp>

<Data "gw.bandwidth"> # name

Type "if_octets" # value type, is defined in the type.db (located /usr/share/type.db)

Table true # get many values (snmpwalk)

Instance "IF-MIB::ifName" # MIB which defines the type_instance. In this case the interfaces

Values "IF-MIB::ifHCInOctets" "IF-MIB::ifHCOutOctets" # MIBs to collect.

</Data>
<Host "gw.troopers.net"> #name for the DB

Address "$IPv4"

Version 3

SecurityLevel "authPriv"

Username "$user"

AuthProtocol "SHA"

AuthPassphrase "$Passphrase"

PrivacyProtocol "AES"

PrivacyPassphrase "$Passphrase"

Collect "gw.bandwidth" "gw.bandwidth.v4" "gw.bandwidth.v6" #which of the defined <Data> should be collected at this Host

</Host>

</Plugin>
This is just one example of the SNMP configuration. The second module we used was the exec plugin. Which executes a script with a specific system user periodically and sends the returned values to the database. We used this to do some additional calculations to the collected SNMP values before they get into the database. More details about the script can be found below.
LoadPlugin exec
<Plugin exec>

Exec "$user" "/home/$user/scripts/snmp_gw_wlc_troopers.py" "collectd"

</Plugin>
One important thing is that we defined some additional types (types_local.db) which need to be added to the types.db (/usr/share/collectd/types.db). For our purpose this was the simplest way but there is one problem. If collectd gets updated the types.db is replaced with the updated version and all of your own definitions are gone.
As everything was setup we activated the collectd service and influxdb service. As a last step we have to configure the Grafana dashboard to show our collected data.
For that we did some adjustments to the configuration file (/etc/grafana/grafana.ini) to disable some features we do not use and enable the ability to view the dashboard without login. Additionally we used ngnix as proxy to connect via port 80 to the Grafana dashboard, which was only accessible via localhost on port 8080.
[server]

http_addr = 127.0.0.1

http_port = 8080
[analytics]

reporting_enabled = false

[security]

disable_gravatar = true
[users]

allow_sign_up = false

allow_org_create = false
[auth.anonymous]

enabled = true

org_name = Troopers

org_role = Viewer
After that we restarted the grafana service and logged into the grafana dashboard with our admin account and connected the influxdb.
Grafana => Data Source => Add New ==>
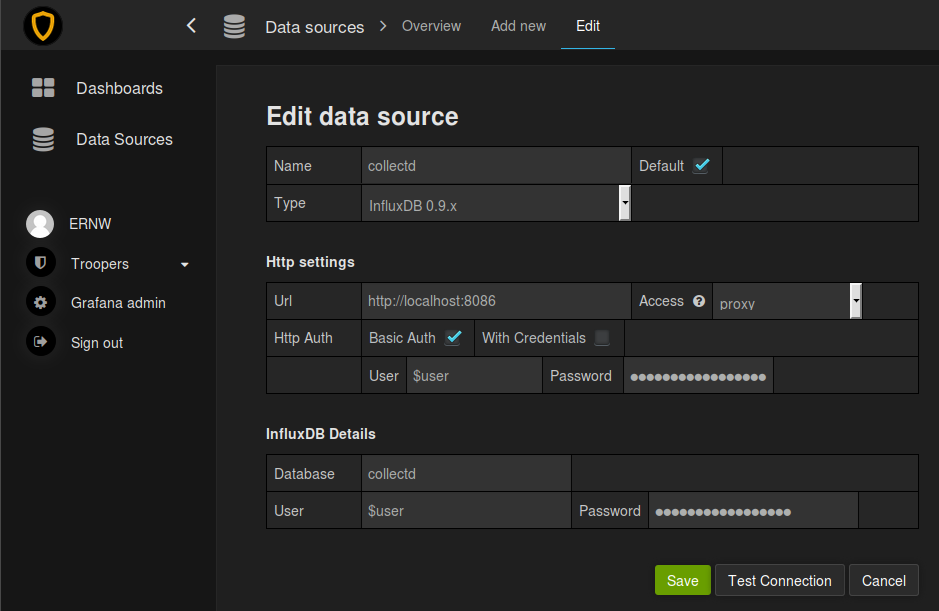
The last step was to create our own dashboard to show the collected data. We attached the dashboard we created (home_dashboard_troopers.json) which can be imported into grafana to take a detailed look at the queries we used. All config files, scripts and the dashboard file can be found in our GitHub repo netmon_troopers.
The “magic” behind the scripts
There are two shell scripts and one python script we created. The two shell scripts are used to collect data via SNMP and return those. Then the python script does all the magic and returns the values which will be written to the database.
The first shell script (cisco_arp_nbc.sh) is used to collect the list of MAC addresses from the legacy ARP and IPv6 Neighbor Cache table for each VLAN from our gateway used during Troopers.
The second shell script (cisco_wlc_bands.sh) is used to collect how many wifi clients are connected over each wireless band (a/b/g/n 2.4 GHZ /n 5 GHZ)
Both shell scripts are used by the python script (snmp_gw_wlc_troopers.py) to get the information over SNMP from the the WLC and our gateway. Now for the “magic” part. We wanted to calculate the amount of clients using only IPv4, IPv6 or both (dualstack). To get this information we are using the table with the MAC addresses from the ARP and Neighbor cache and compare them. If a MAC address can be seen in both the ARP and Neighbor Cache it is considered as Dual-Stack client. If the MAC can only be seen in the ARP cache it is considered IPv4-only and the same applies for entries in the IPv6 Neighbor Cache. The amount of clients for the different categories are counted and returned to save them in the database. As you can see from the screenshot above, we had some “issues” in the first to days with regards to IPv6-only clients. The blue “line” was always growing. It seems that the IOS Image on our gateway did not delete Neighbor Cache entries at all, which lead to the permanent increase (the huge dips after the first and second day happened because we manually deleted the neighbor cache). We are not sure if this is intended or a bug, but we adjusted the neighbor cache lifetime to 1 hours after the second day, and after that the figures became much more realistic. The wireless band information are just collected via the shell script and then returned in the correct format so that collectd can save them to the database.
Currently, we plan to replace the shell script and do the SNMP requests inside the python scripts. In addition, we want to get more information via SNMP from the WLC about the health of the network (APs et.al.)
Hope all of you enjoyed Troopers and see you 2017 in Heidelberg again!
Cheers,
Rafael