BloodHound data collection, aka Sharphound, is quite a complex beast.
When giving BloodHound workshops, the part where I get the most questions is
always data collection.
How is the BloodHound data collected? What methods do what? Who am I talking
to? How do I fly under the radar?
These are all very relevant questions when you think about it.
After all, the rest is just a gorgeous UI sitting on top of a cool data model,
but the only bit of BloodHound code that ever touches the targeted network is
SharpHound. And so questions about it should be mandatory.
Now even thought I’ve been working with BloodHound for quite a while, there is
always this moment where I have to check before answering… (I feel the older I
get, the quicker I understand, but the less I remember… but that’s another story
I guess…)
A lot of info is available online to understand what happens under the
SharpHound hood.
The official BloodHound documentation
here,
a couple of very helpful posts from @CptJesus
here and
here, and of course the
SharpHound source code itself
here.
But that’s a lot to read to be honest… and in the BloodHound philosophy we have
to think in graphs…
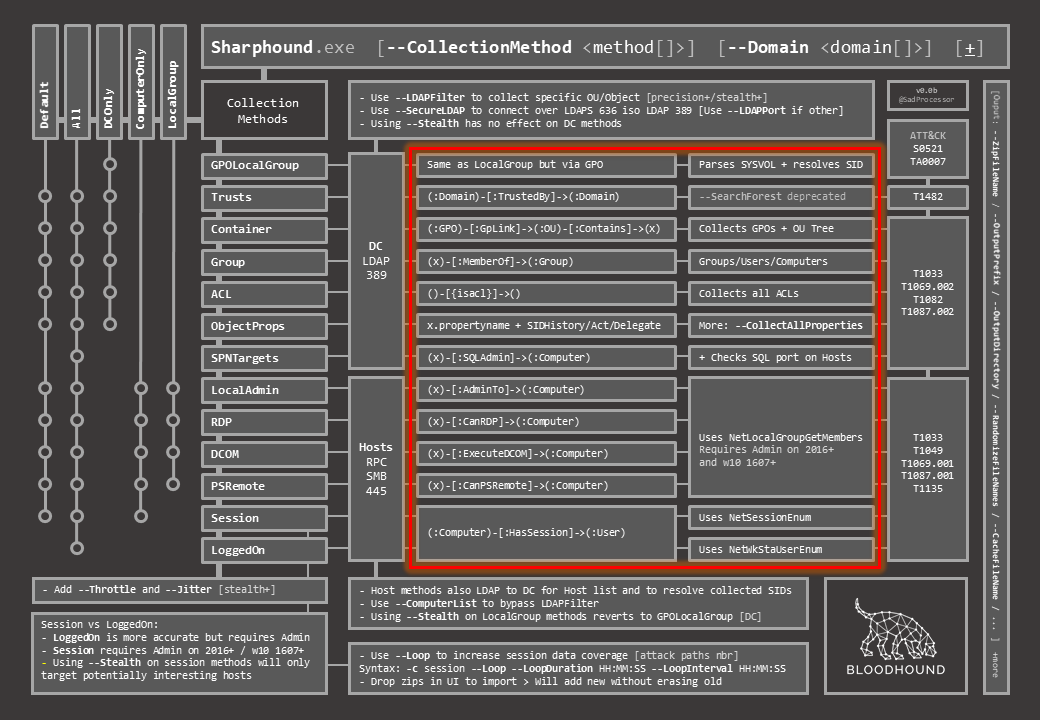
So I made one.
(TL;DR get it
here)
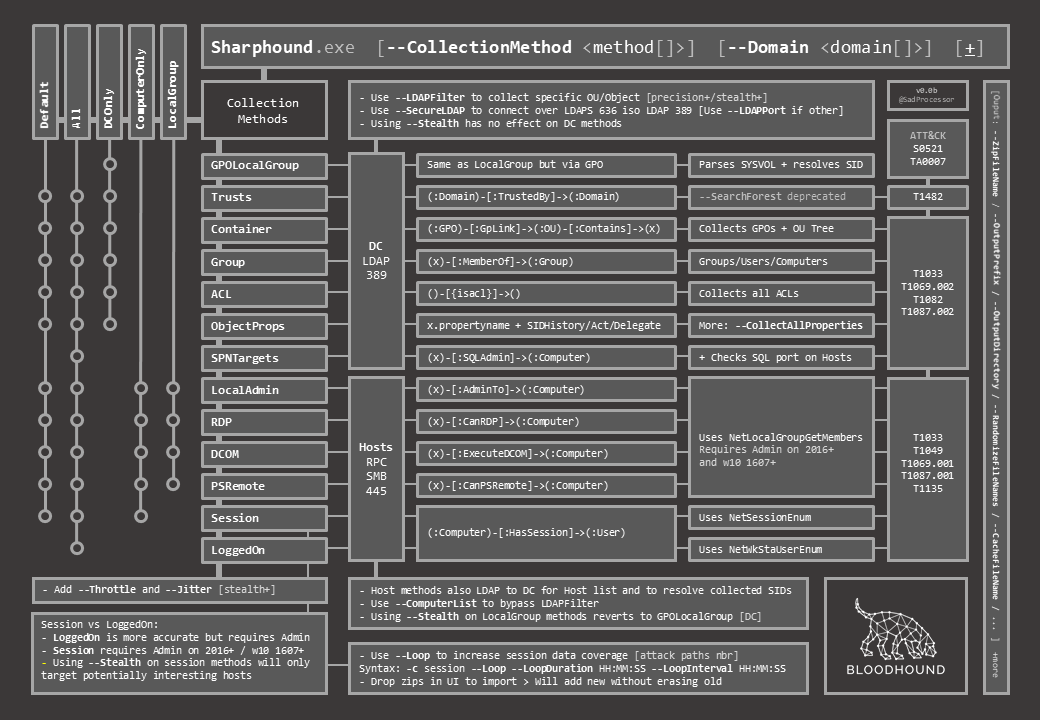
The challenge was to have it all fit on a single slide, so I could add it to my
deck and fall back to it when in need for a cheat.
The result may be a bit complicated to follow at first, so in this post I’ll
quickly detail how to read the document.
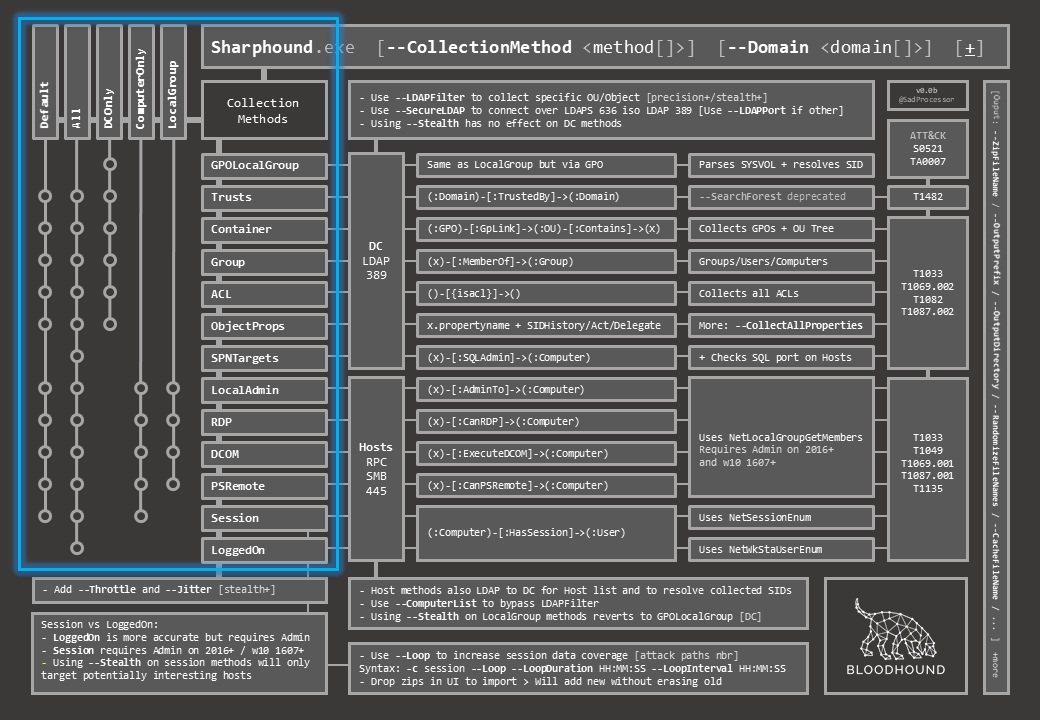
On the top left are all the methods. Horizontally are individual methods, vertically are bunbles of individual methods. The “metro map” representation shows what individual methods are executed in each bundle.
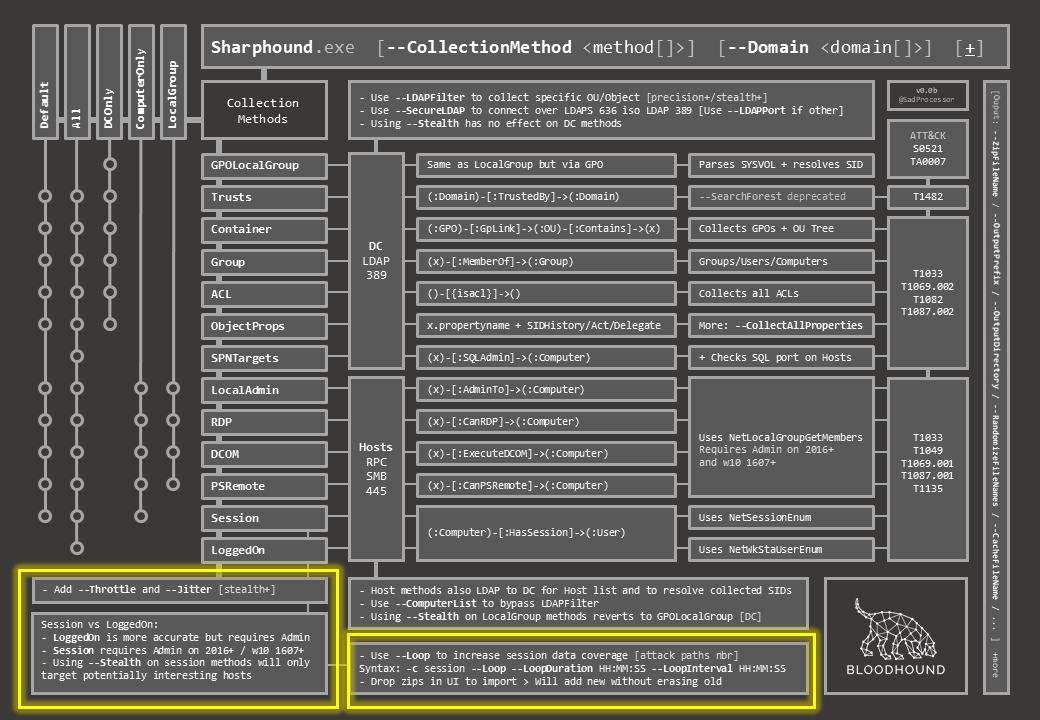
Below are the classic switches to add some randomness in timing between queries on all methods (–Throttle & –Jitter), and a quick explanation of the difference between Session and loggedOn when it comes to collecting the “HasSession” relationship, as well as the basic session loop collection switches to increase session data coverage.
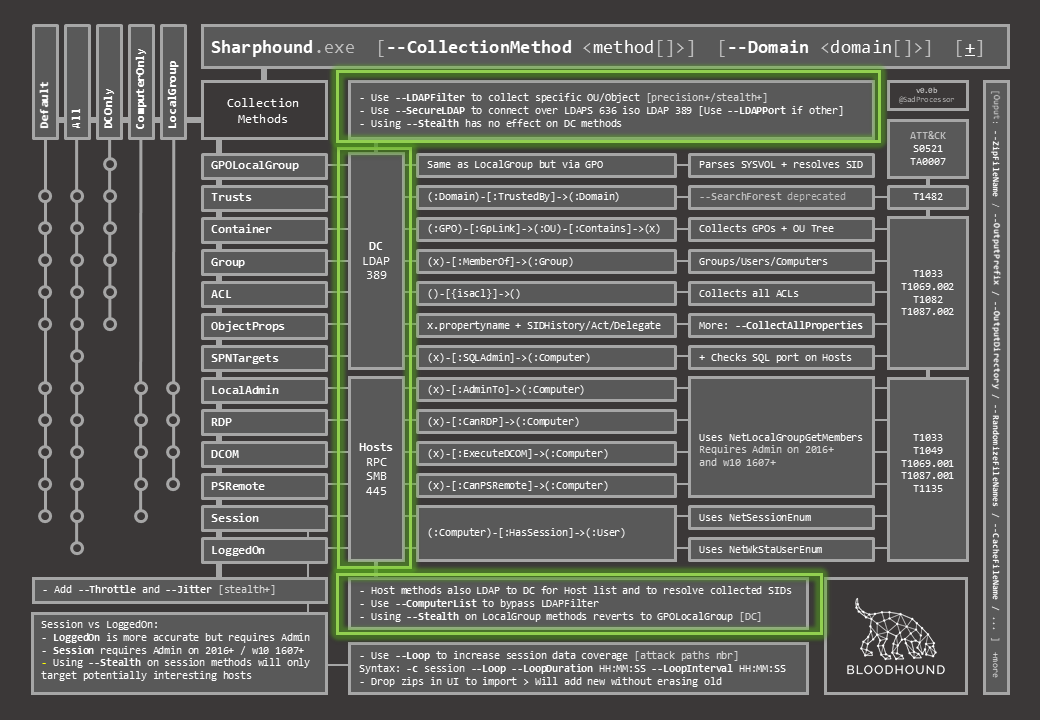
To the right, for each of the individual methods, you will find extra info on the targeted object and communication used (LDAP to DC vs. RPC/SMB to Hosts), with extra switches to fine tune collection to both target types.
The next two columns will give you a Cypher-like representation of what is collected, and some extra info for each of the individual methods.
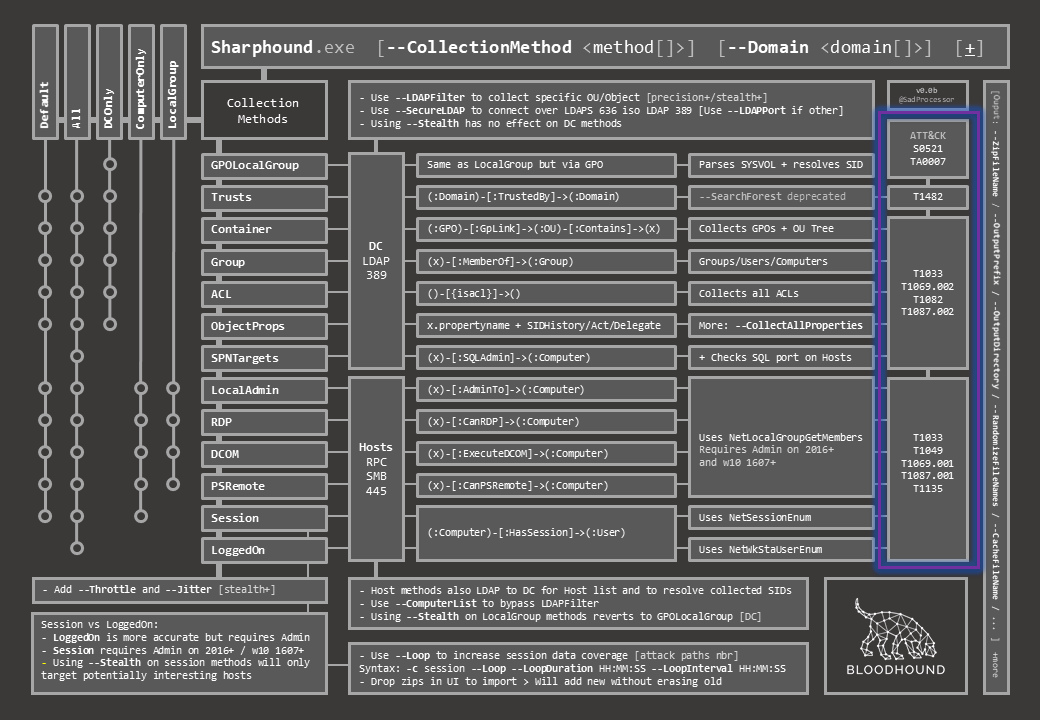
The last column maps each method to the matching ATT&CK technique ID so as to further connect them to associated detection data sources and possible mitigation.
Finally, and with the tiny bit of space left, I added some of the extra output switches that can come in handy when trying to avoid being caught writting to disk with default BloodHound file names…
This cheat sheet covers only the basics when it comes to BloodHound Data
Collection, but I really couldn’t fit more on it. Still, I hope you will find it
useful…
As for flying under the radar, it will of course depend on what you are up
against, but avoiding the Default/All methods is probably a good start… In
general, low and slow and understanding what you are doing is the way to go… and
I hope this document can help.
There are many more switches available and the
BloodHound documentation
is the most complete and up-to-date source of info there is out there (a part
from the SharpHound source code
itself ofc…) so make sure to check it out…
One last thing… my BloodHound slide deck is dark-themed so the cheat sheet is
too, but I also made a printer-friendly version if you prefer (Hack the planet
AND Save the planet).
Both can be downloaded
here in
PDF format.
Please feel free to ping me on the BloodHound Slack if you have any questions or feedback,
Until next time…
Cheers,
Take Care,